Computation
The Fault Tree module calculates the probability of failure (Unavailability) of a given fault tree. This probability can be calculated via two different types of calculation: The Exact method and the Minimal Cutsets method.
The Unavailability of the top gate is calculated taking the probability of each primary event and applying the logic of the gates. The primary events have different ways to enter the probability: Constant, Failure Rate and MTBF. Moreover, the primary events can be also dormant or hidden.
Average Flight Time (AFT)
The Average Flight Time is the mean time that the flight mission lasts, in hours. This time is taken to normalize the top gate probability per flight hour.
The AFT is defined when the project is created.

Operation Time
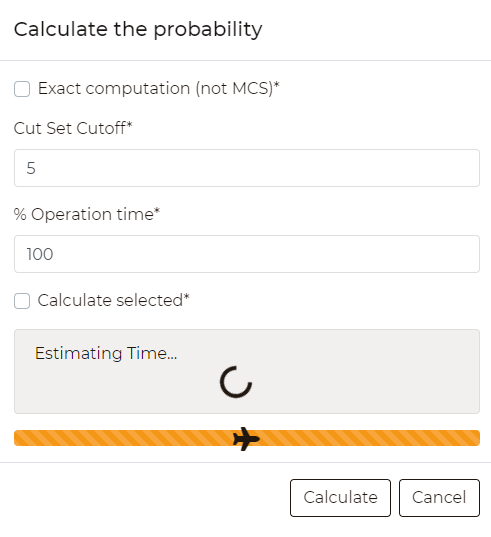
The Operation Time (OT) is the percentage of time with respect to the AFT over which the Unavailability computation is performed. It can be used to calculate the probability of a certain incident taking place on a specific mission segment (e.g. during take-off). Computationally, it multiplies the Unreliability at the basic event level, thus affecting the value of each subsequent parent gate.
However, the OT does not apply to hidden or dormant events. The OT is defined as a computation parameter in the “Calculate the probability” dialog box.
Primary Events Parameters
When a new primary event is inserted, one of the following calculation models shall be chosen:
Constant probability
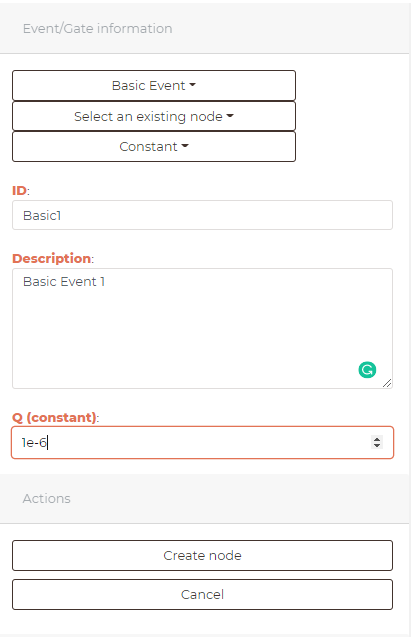
In this model, the user can directly enter the Unavailability (Q). This value will remain constant.
The value can be entered with scientific notation (e.g. 1e-6)
Failure Rate
In this model, the user can enter the failure rate to calculate the Unavailability (Q).
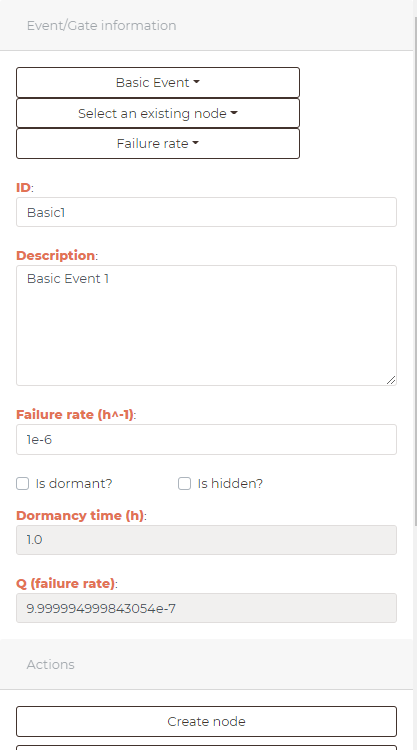
The Unavailability of the event is calculated using the following equation:
\[Q = 1 - e^{-\lambda t}\]where:
\(\lambda\) is the Failure Rate
t is the dormancy/life time (see the Dormant/Hidden Primary Events section)
MTBF
In this model, the user can enter the MTBF (Mean Time Between Failure) to calculate the Unavailability (Q).
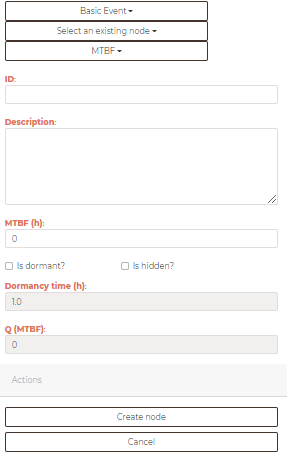
The Unavailability of the event is calculated using the following equation:
\[Q = 1 - e^{-\lambda t}\]where:
\[\lambda = \frac{1}{MTBF}\]MTBF is the Mean Time Between Failure
t is the dormancy/life time (see the Dormant/Hidden Primary Events section)
Dormant/Hidden Primary Events
For Failure Rate/MTBF models, the primary event could be treated as Dormancy Event or Hidden Event checking the corresponding checkboxes as shown in the picture below:
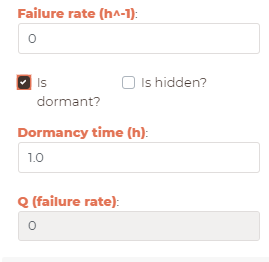
The Unavailability is defined by the Dormancy Time if the event is a dormant or by Life time if the event is hidden.
Note
If the event is not a dormant or hidden event, the AFT will be the value of t by default.
Vote Gate (K-of-N)
Beyond the AND and the OR gates, Robin supports the Vote gate, which represents a redundant configuration where the output occurs when at least \(K\) out of its \(N\) inputs occur. It is the usual way of modelling a redundancy such as “2 out of 3 channels must fail for the function to be lost”.
The Vote gate is logically equivalent to the OR of every possible AND combination of \(K\) of its children. Therefore, each combination of \(K\) children is a cut set of the gate, and the number of cut sets it contributes is:
For the particular case where all the \(N\) inputs are independent and share the same probability \(q\), the probability of the Vote gate reduces to the binomial expression:
In the general case, where the inputs have different probabilities and may share basic events, Robin applies the same combination logic used for the rest of the gates, so that repeated events are correctly accounted for in both the Exact Method and the Minimal Cutsets analysis.
Note
The value of \(K\) must be an integer between 2 and \(N\). The limit cases are already covered by the other gates: \(K=1\) is an OR gate and \(K=N\) is an AND gate.
Warning
The number of cut sets generated by a Vote gate grows very quickly with \(N\). A gate with a large number of children and an intermediate value of \(K\) can noticeably increase the computation time of the Minimal Cutsets analysis.
Creating and editing a Vote gate
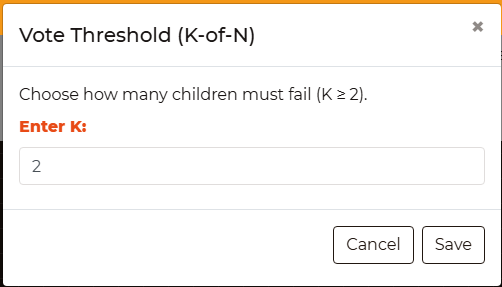
A Vote gate can be created in the same way as the rest of the gates from the diagram, and it can also be used as the top gate of a fault tree. When the gate is created, or when its type is changed to Vote, Robin opens the Vote Threshold (K-of-N) dialog to introduce the value of \(K\).
The dialog indicates the number of children \(N\) of the gate and only accepts values within the valid range. The threshold can be modified at any time by editing the gate.
Note
Changing the type of an existing gate to Vote, or changing the value of \(K\), invalidates the previous results. The calculator symbol turns red to indicate that the tree needs to be recalculated.
Type of Calculation Method
There are two different types of calculation in Robin: Exact Method and Minimal Cutsets (MCS).
Minimal Cutsets calculation method
The Minimal Cut Sets are the smallest groups of basic events that combined cause the top event to occur.
Once the minimal cut sets are found, the top event probability \(Q_T\) can be approximated with the so-called “rare event approximation”:
\[Q_T \cong \sum_i Q_i\]where \(Q_i\) denotes the unavailability of each considered cut set, which can be expressed as the product of all the basic events conforming that cut set:
\[Q_i = \prod_k Q_k\]This method ignores the possibility of two or more minimal cut sets being simultaneous, but it generally gives results agreeing within 10% of the exact unavailability for Q<0.1.
Although the MCS enables the analytical computing of Fault Tree Analysis, a maximum order of cut sets has to be set to improve the performance of the computer-aided calculation. A cut set cutoff allows the higher-order cut sets, which have a small contribution to the total probability (e.g. a few orders of magnitude less than 10-9), to be ignored as they would not have a relevant effect on the overall probability calculation.
To calculate the Unavailability using the Minimal Cutsets, click on the red calculator. Leave unchecked the Exact computation (not MCS)* option. The user can define the cutset cutoff and the percentage of operation time. Finally, the user can calculate only a selected gate clicking first in a gate and checking the option Calculate selected*.
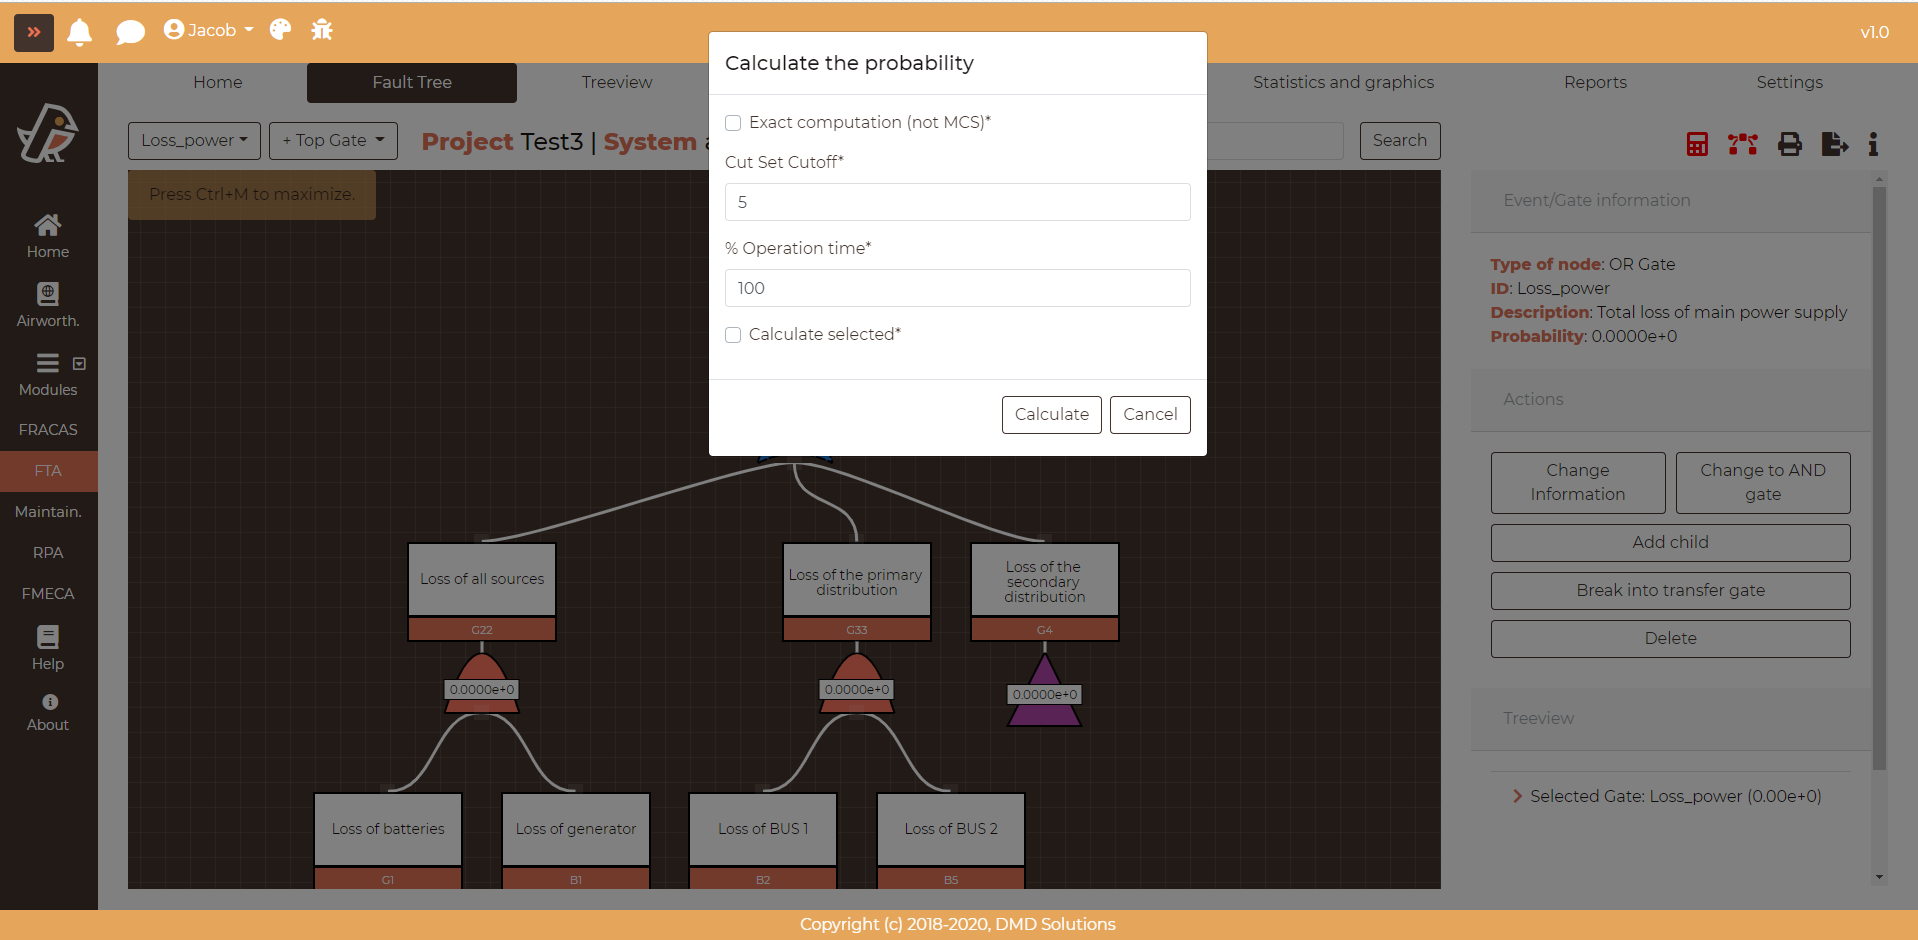
The method of Minimal Cut Sets is extensively used and accepted by many industries as it provides an approximation that can be tailored to obtain a result suitable for certification substantiation, which usually involves usage of small probabilities (order of magnitudes smaller than 0.1). For applications where higher probabilities are used, MCS is not a suitable solution.
Exact calculation method
The Minimal Cut Sets methods are widely used due to its performance advantages and not needing the data of all the basic events. However, an exact solution can only be achieved using the direct analysis evaluation, which involves creating a top-down recursive algorithm that directly analyzes the exact probability of the desired event not considering minimal cut sets or maximum order of cut sets.
To calculate the Unavailability using the exact, click on the red calculator. Check the Exact computation (not MCS)* option. The user can define the percentage of operation time, the cutset cutoff parameter will be disabled for this calculation method. Finally, the user can calculate only a selected gate clicking first in a gate and checking the option Calculate selected*.
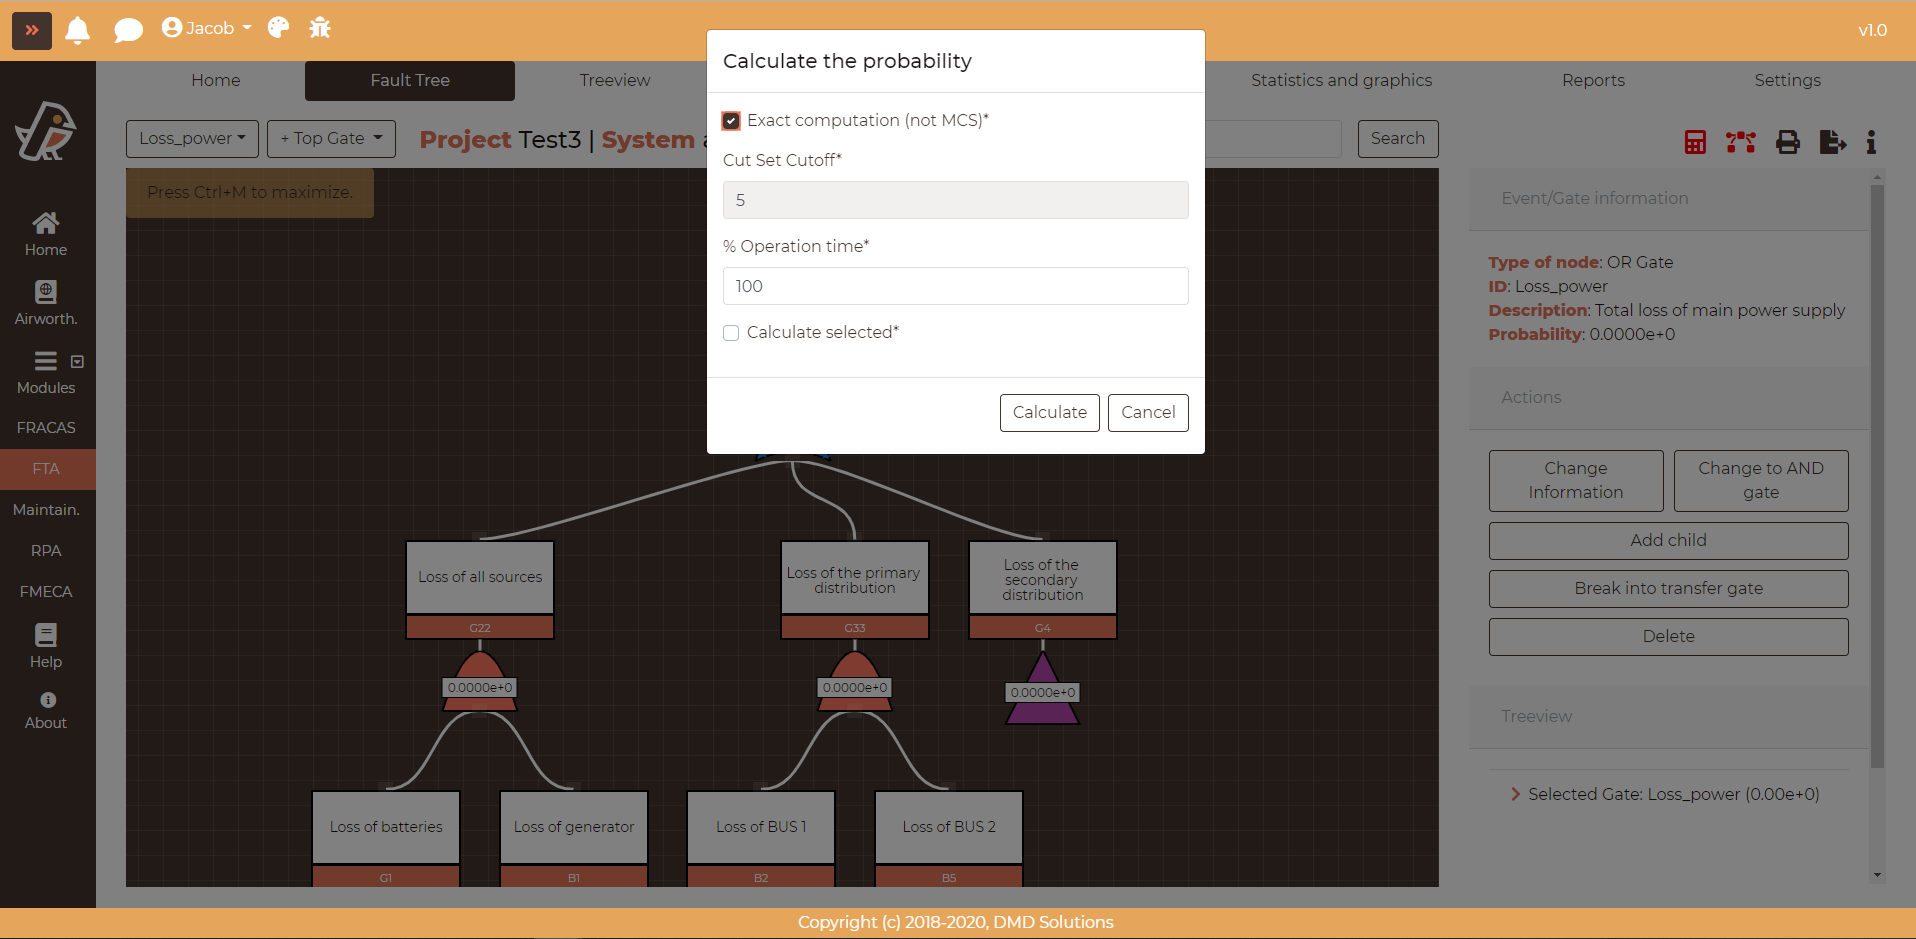
This method gives the exact top gate probability but needs more computational resources and the spends more time than the Minimal Cutsets method.
Note
The calculator symbol will be red if the fault tree has been modified and needs to be recalculated. Once the probability has been calculated, the calculator color will change to brown.
Minimal Cutsets Analysis
Minimal cut set analysis identifies all combinations of basic events that result in the occurrence of the top event. These basic event combinations, called cut sets, are then reduced to identify those “minimal” cut sets, which contain the minimum sets of events necessary to cause of the top event. This analysis ensures that any single event that appears repeatedly in various branches of the fault tree is properly accounted for.
The result of this analysis is a report (PDF) with the list of all the minimal cutsets (the ones containing a dormant/hidden event are highlighted) and their probablities. This analysis is useful to identify the Single Points of Failure (SPFs) that lead to the top event to occur.
To calculate the Minimal Cutsets, click on the red symbol circled in the picture below. Define the Cut Set Cutoff and the Probability Cutoff parameters. These parameters are used to assign a cutoff in order to improve the speed of the analysis, ignoring the minimal cutsets that would not have a relevant effect on the overall probability calculation.
The user can analyze only the Minimal Cutses of a selected gate clicking first in a gate and checking the option Calculate selected*.
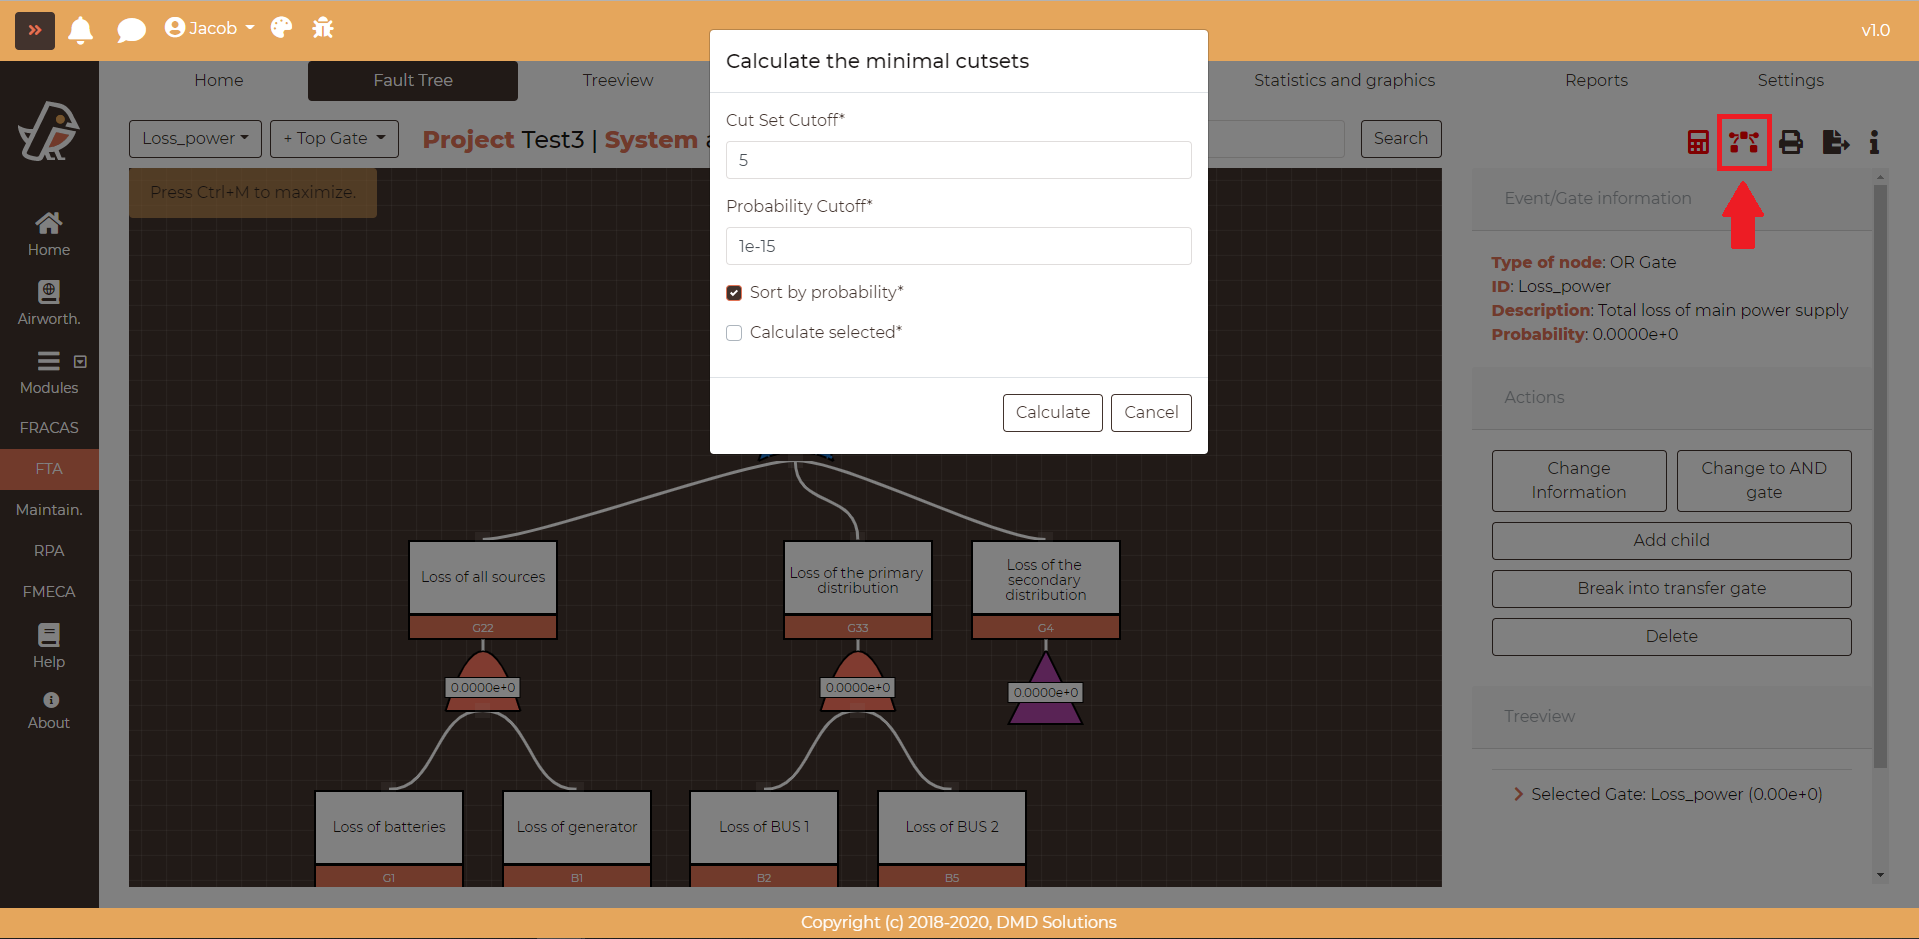
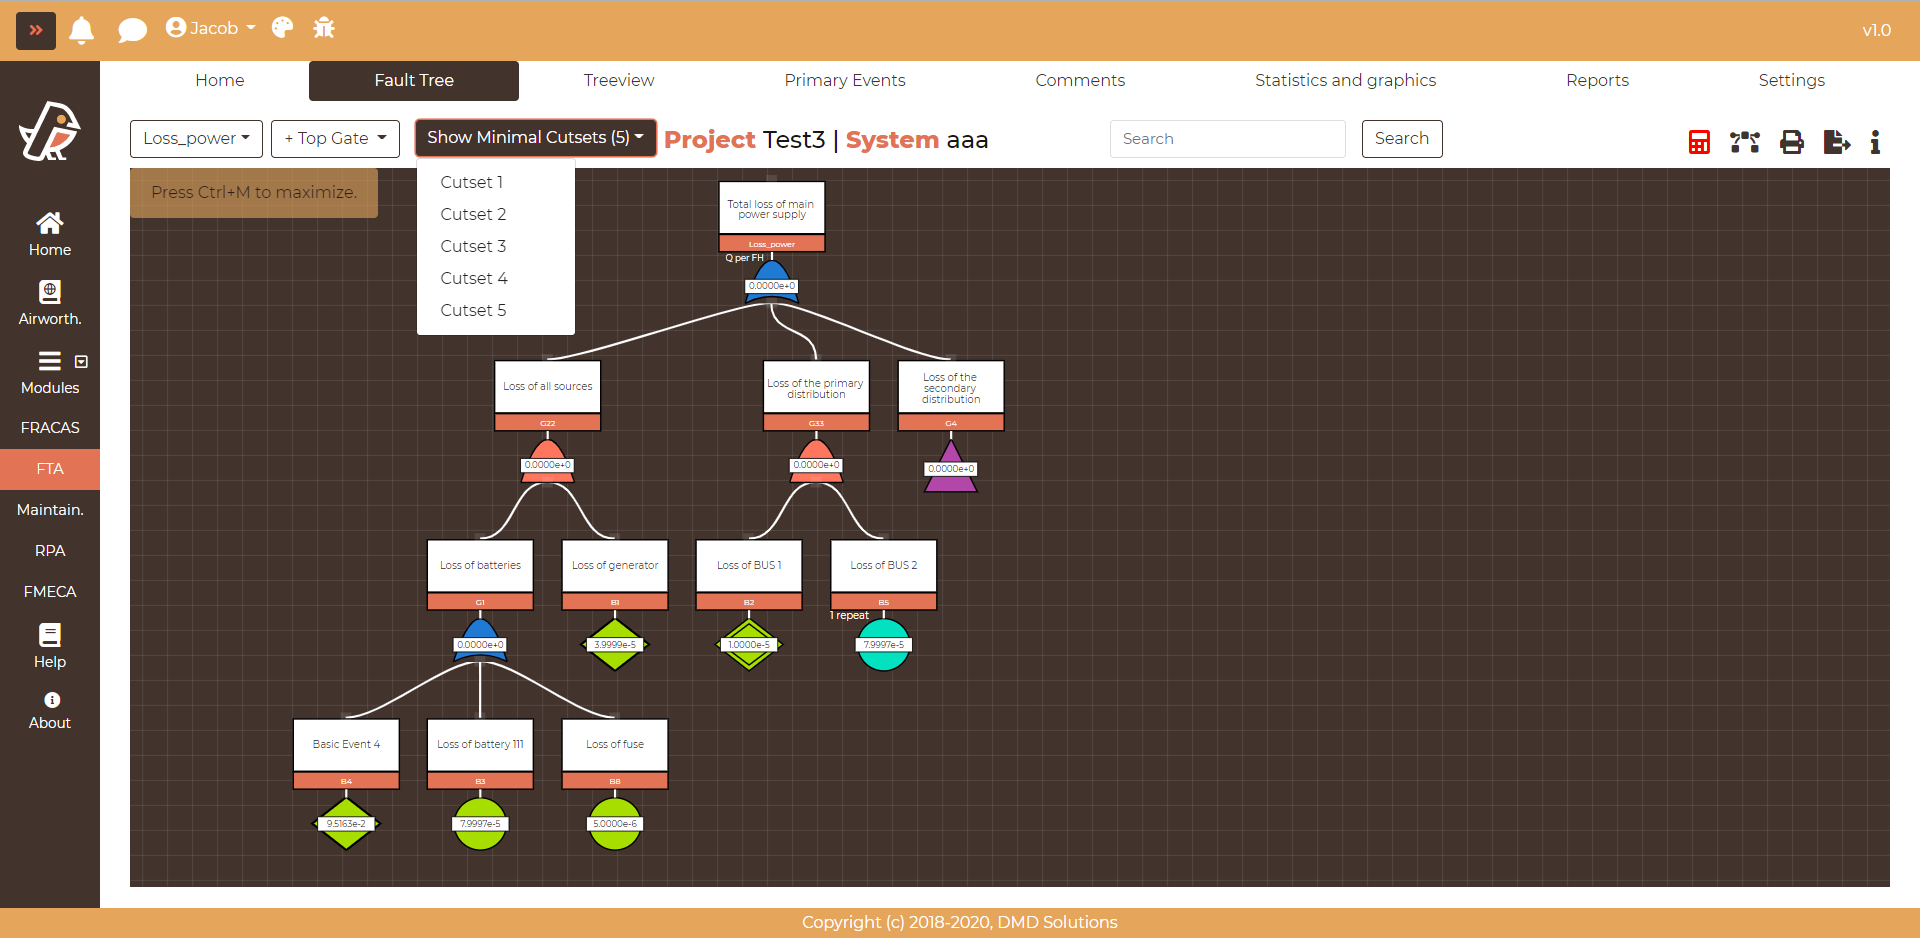
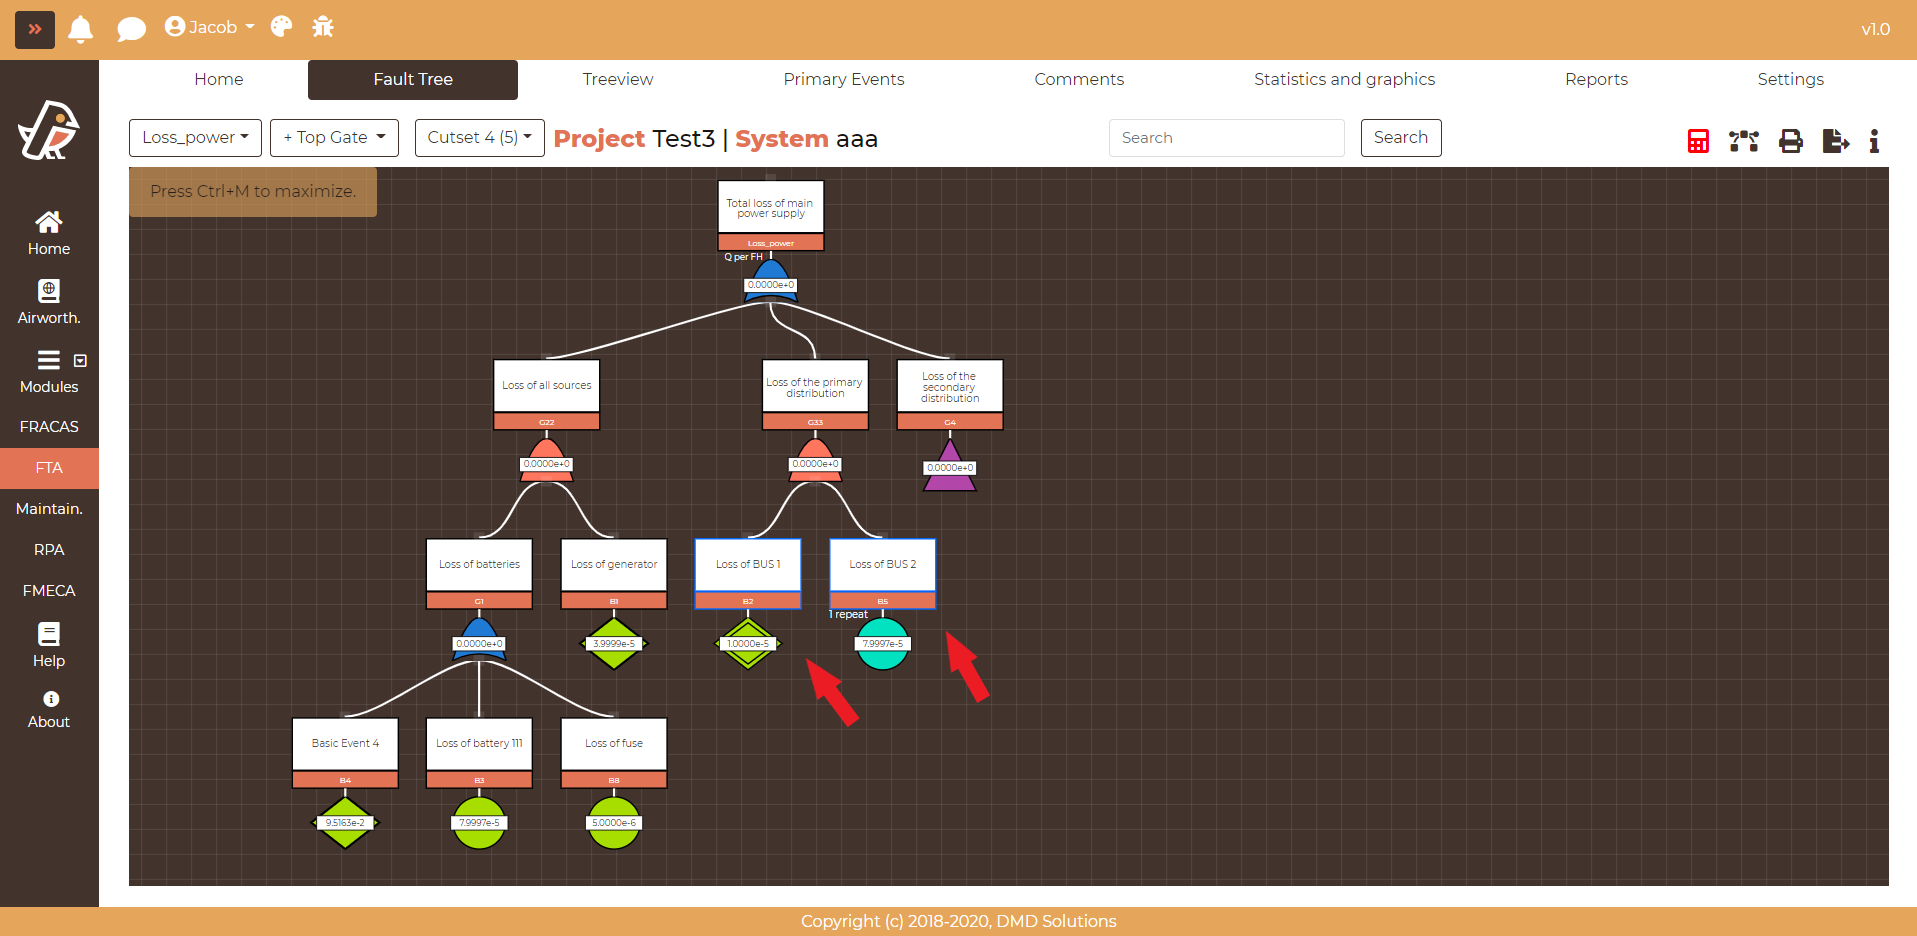
Once the Minimal Cutsets have been analyzed, the user can highlight the different minimal cutsets clicking on the new dropdown and selecting a cutset as shown in the pictures below.
Note
The Minimal Cutset symbol will be red if the fault tree has been modified and needs to be recalculated. Once the probability has been calculated, the symbol color will change to brown.